
Server · #77 trending MCP repo
Ztd Charts
Junhan2/ztd-charts
44 animated, interactive React charts in pure SVG with zero runtime dependencies, a JSON spec, and CLI and MCP tools for AI agents
- Stars
- 312
- This week
- —
- Forks
- 45
- Open issues
- 0
- Skills inside
- 1
Get started
Add it to your agent
claude mcp add ztd-charts -- npx -y ztd-charts-mcpRun in your terminal. Add --scope project to share it with your team through .mcp.json.
codex mcp add ztd-charts -- npx -y ztd-charts-mcpSaved to ~/.codex/config.toml.
{
  "mcpServers": {
    "ztd-charts": {
      "command": "npx",
      "args": [
        "-y",
        "ztd-charts-mcp"
      ]
    }
  }
}Add to ~/.cursor/mcp.json (or .cursor/mcp.json in a project).
{
  "servers": {
    "ztd-charts": {
      "type": "stdio",
      "command": "npx",
      "args": [
        "-y",
        "ztd-charts-mcp"
      ]
    }
  }
}Add to .vscode/mcp.json, then start it from the MCP view in Copilot Chat.
gemini mcp add ztd-charts npx -y ztd-charts-mcpSaved to .gemini/settings.json.
Documentation
README

ztd charts
Animated, accessible React charts that read like a report.
44 charts in pure SVG with no runtime dependencies, and a JSON spec your AI agent can write.



Docs · Gallery · Example dashboards · Playground · 한국어
Why ztd charts
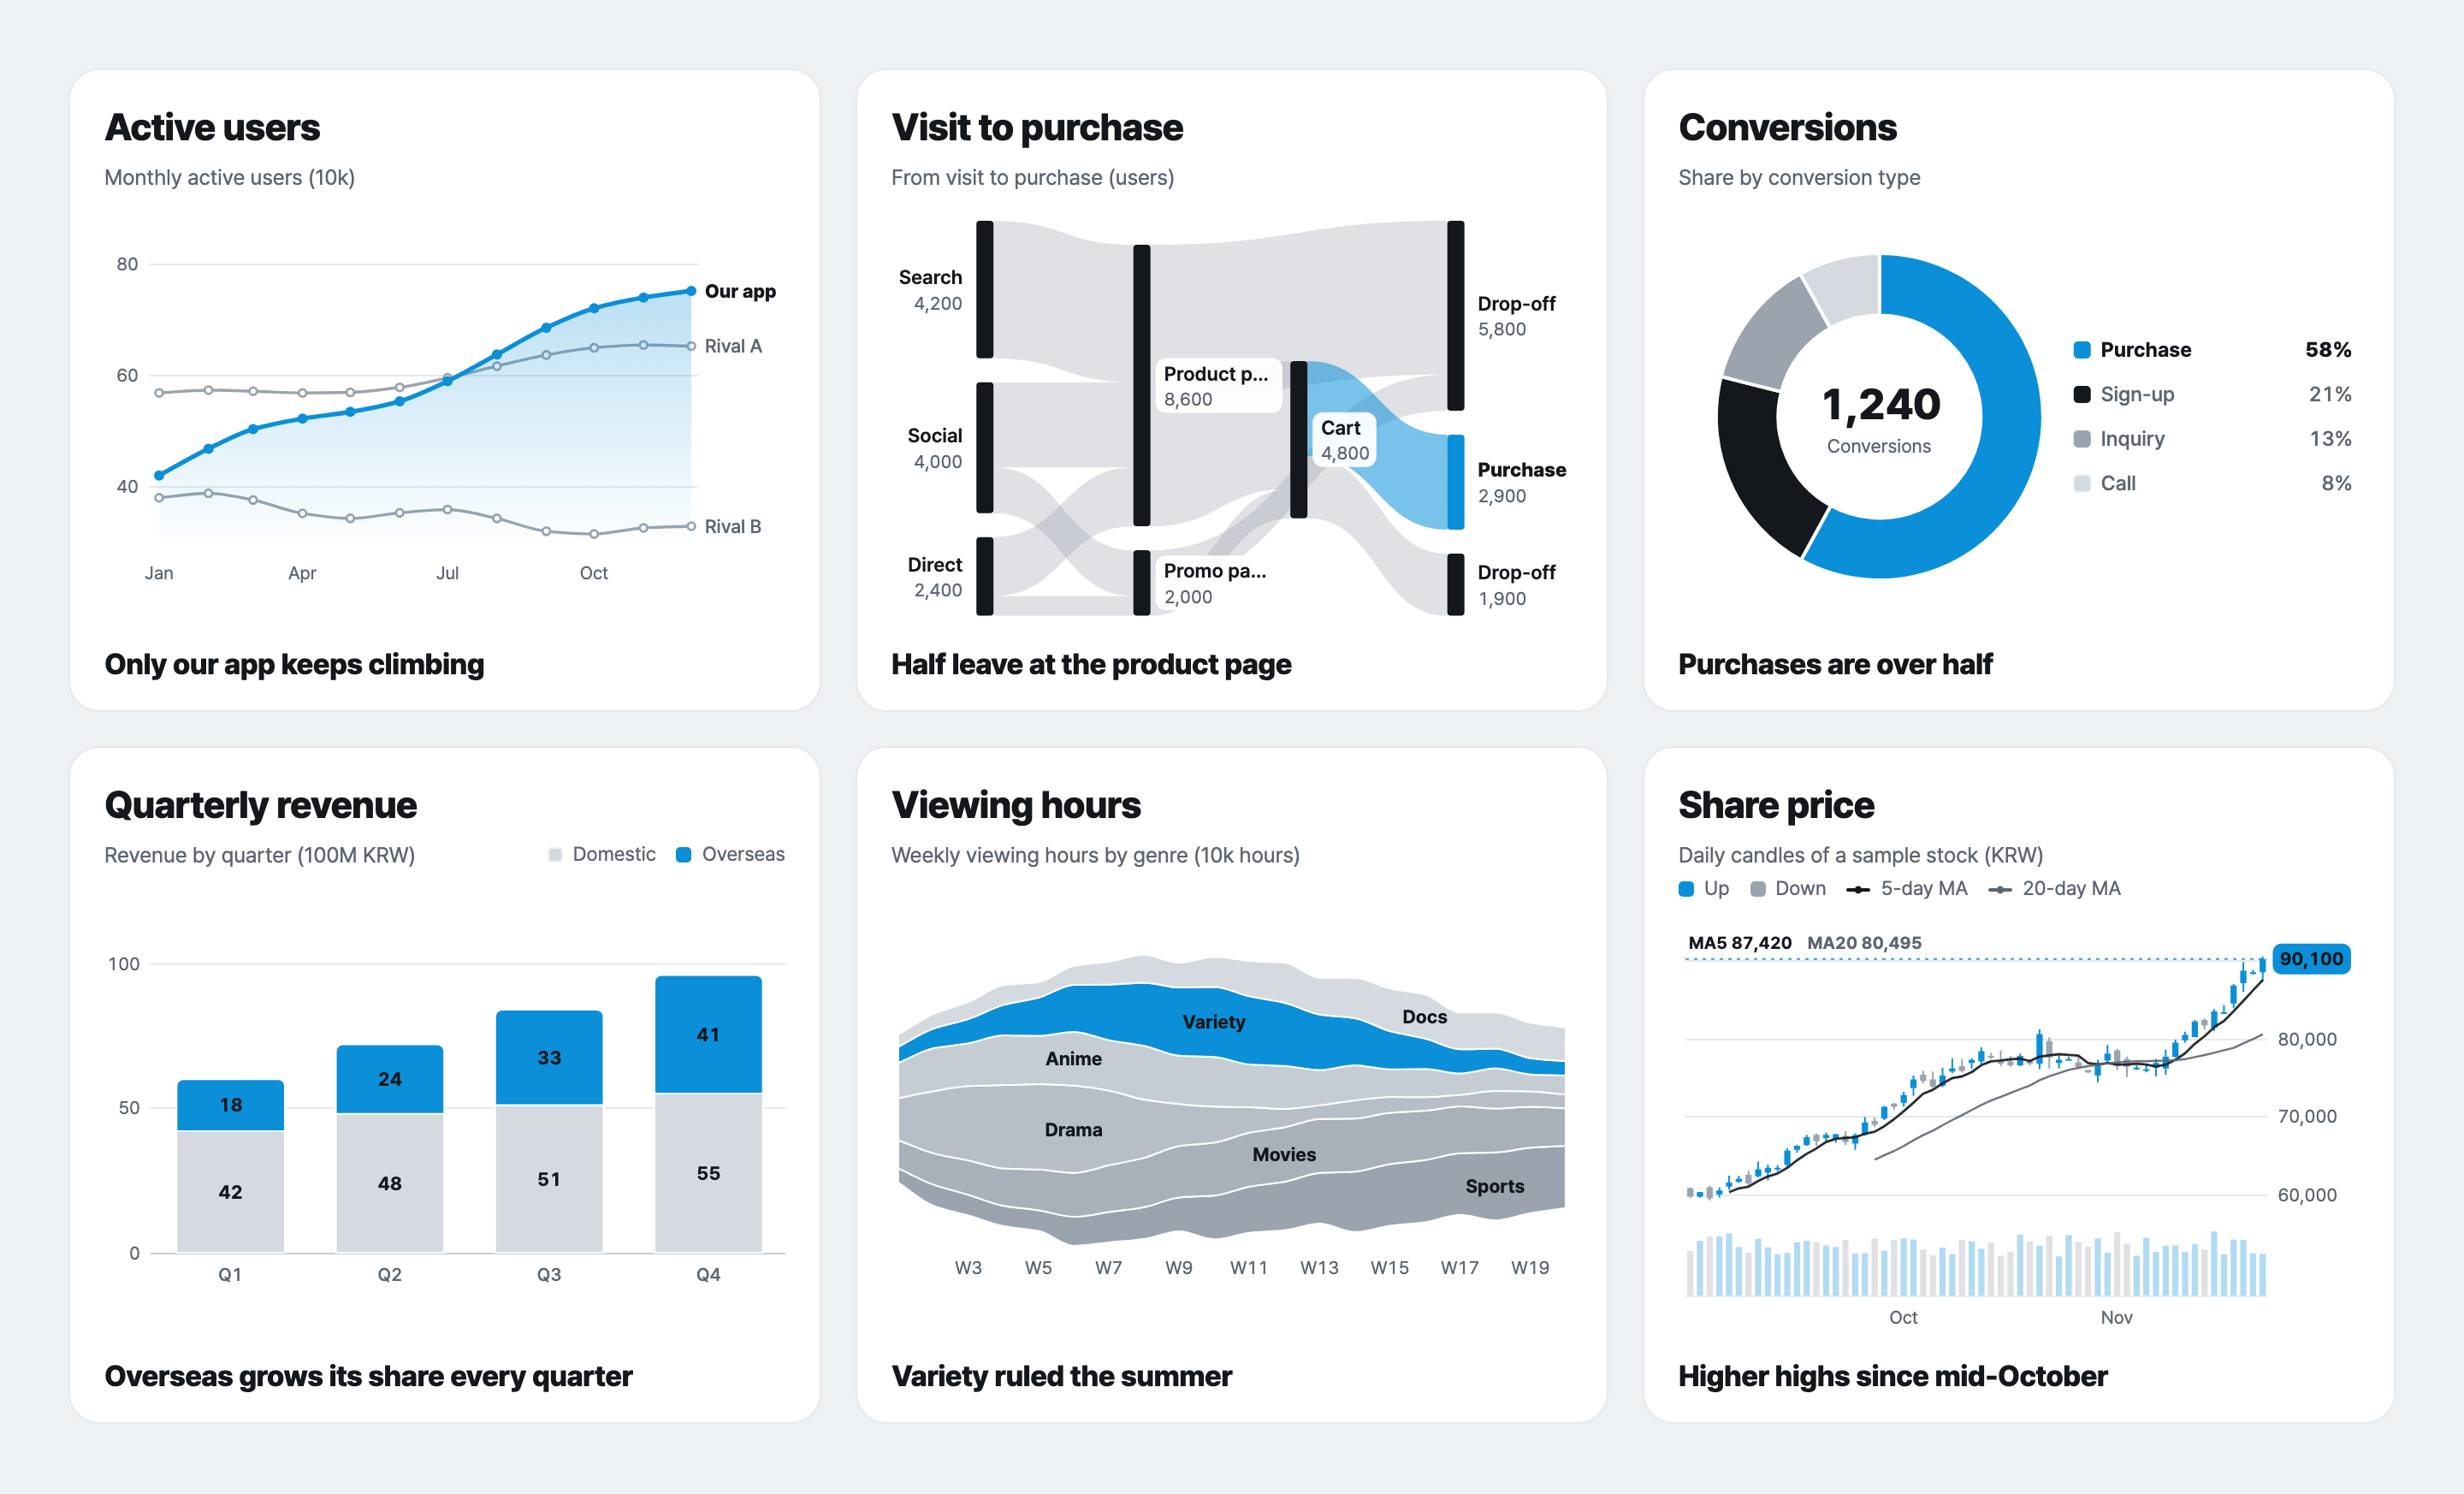
- Each card says one thing. One item takes the accent color and the rest stay neutral, with a bold takeaway under the chart, so a reader sees the point before reading the axes.
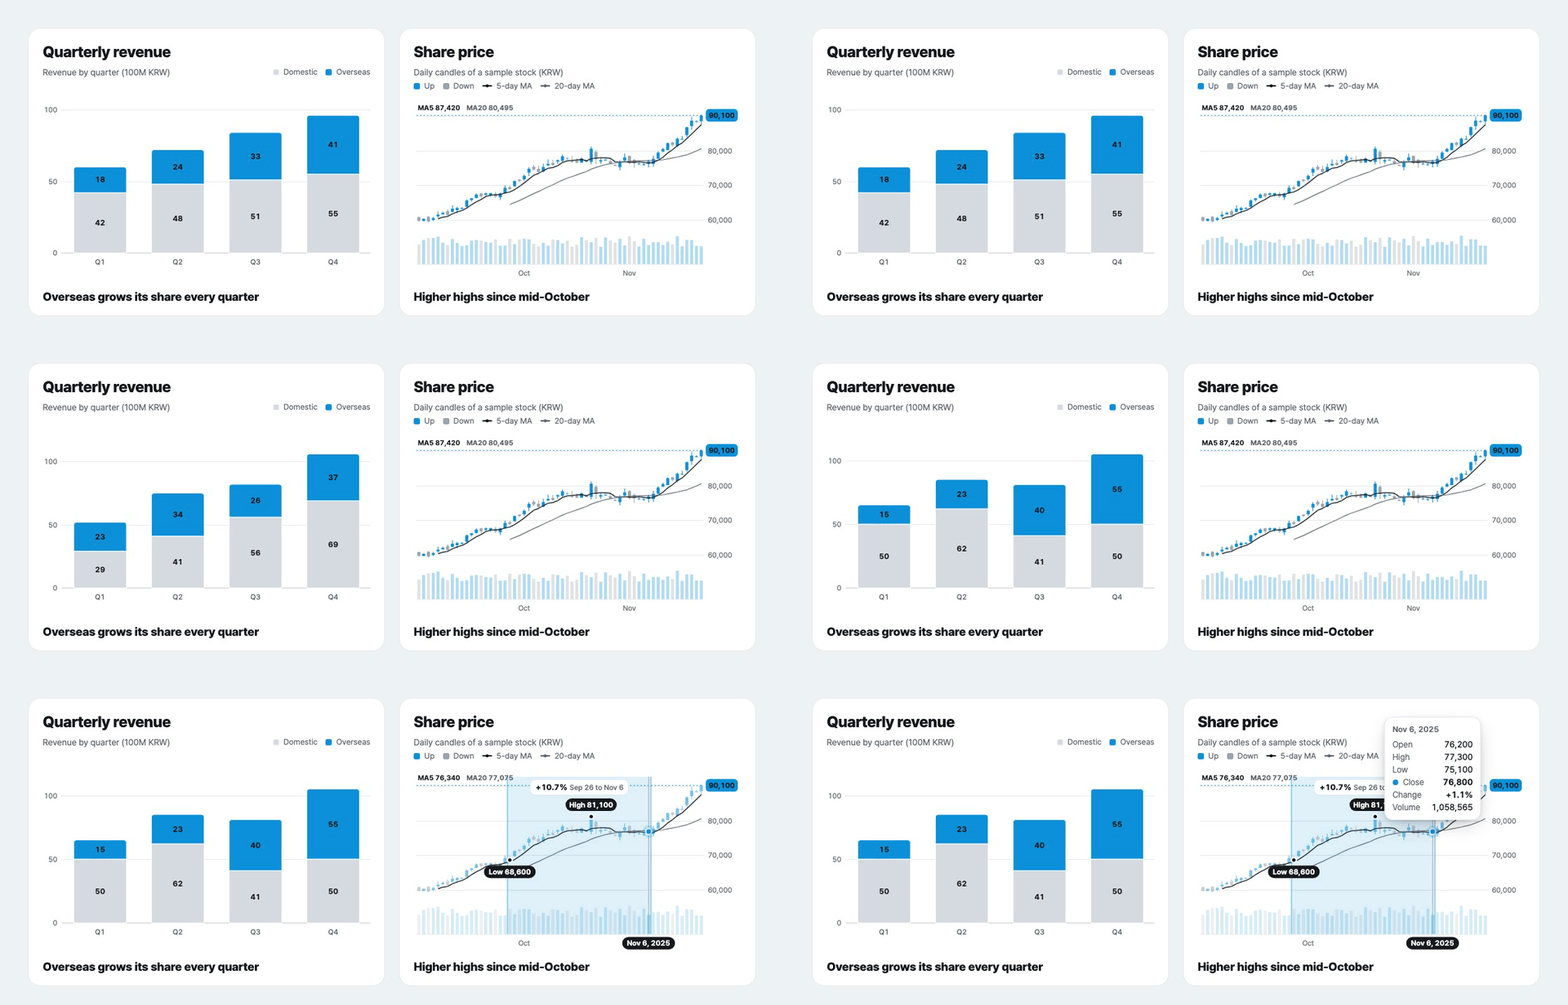
- Motion that explains. Charts draw in as they scroll into view, move on from where they are when the data changes, and let you drag over a range to read its change, high and low.
- Accessible by default. Keyboard navigation, a screen reader description and data table for every chart, reduced motion, and every label at WCAG AA contrast.
- Small, with nothing else to install. React is the only peer dependency. A chart with the shared core is about 12 to 26 kB Brotli, and very large data switches to canvas on its own.
- Ready for AI. Every chart is also a JSON spec with a public JSON Schema, and a CLI, an MCP server and an agent skill validate it and render it to PNG, SVG or HTML.
- English and Korean. en-US by default.
locale="ko-KR"switches number formats (1.2만, 3.4억) and chart text to Korean.
Quick start
npm i ztd-charts
import { ChartCard, PieChart } from "ztd-charts";

const sales = [
  { device: "Mobile", share: 72 },
  { device: "Desktop", share: 23 },
  { device: "Tablet", share: 5 },
];

export function SalesByDevice() {
  return (
    <ChartCard
      title="Sales by device"
      subtitle="Share of revenue (%)"
      legend={[{ label: "Mobile", color: "accent" }, { label: "Desktop", color: "ink" }, { label: "Tablet", color: "neutral" }]}
      takeaway="Mobile brings in most sales"
    >
      <PieChart data={sales} label="device" value="share" highlight="Mobile" />
    </ChartCard>
  );
}
The same chart as a JSON spec, which is what the CLI, the MCP server and an AI agent work with:
import { Chart } from "ztd-charts";

<Chart
  spec={{
    type: "pie",
    data: sales,
    encoding: { label: "device", value: "share" },
    options: { highlight: "Mobile" },
  }}
/>;
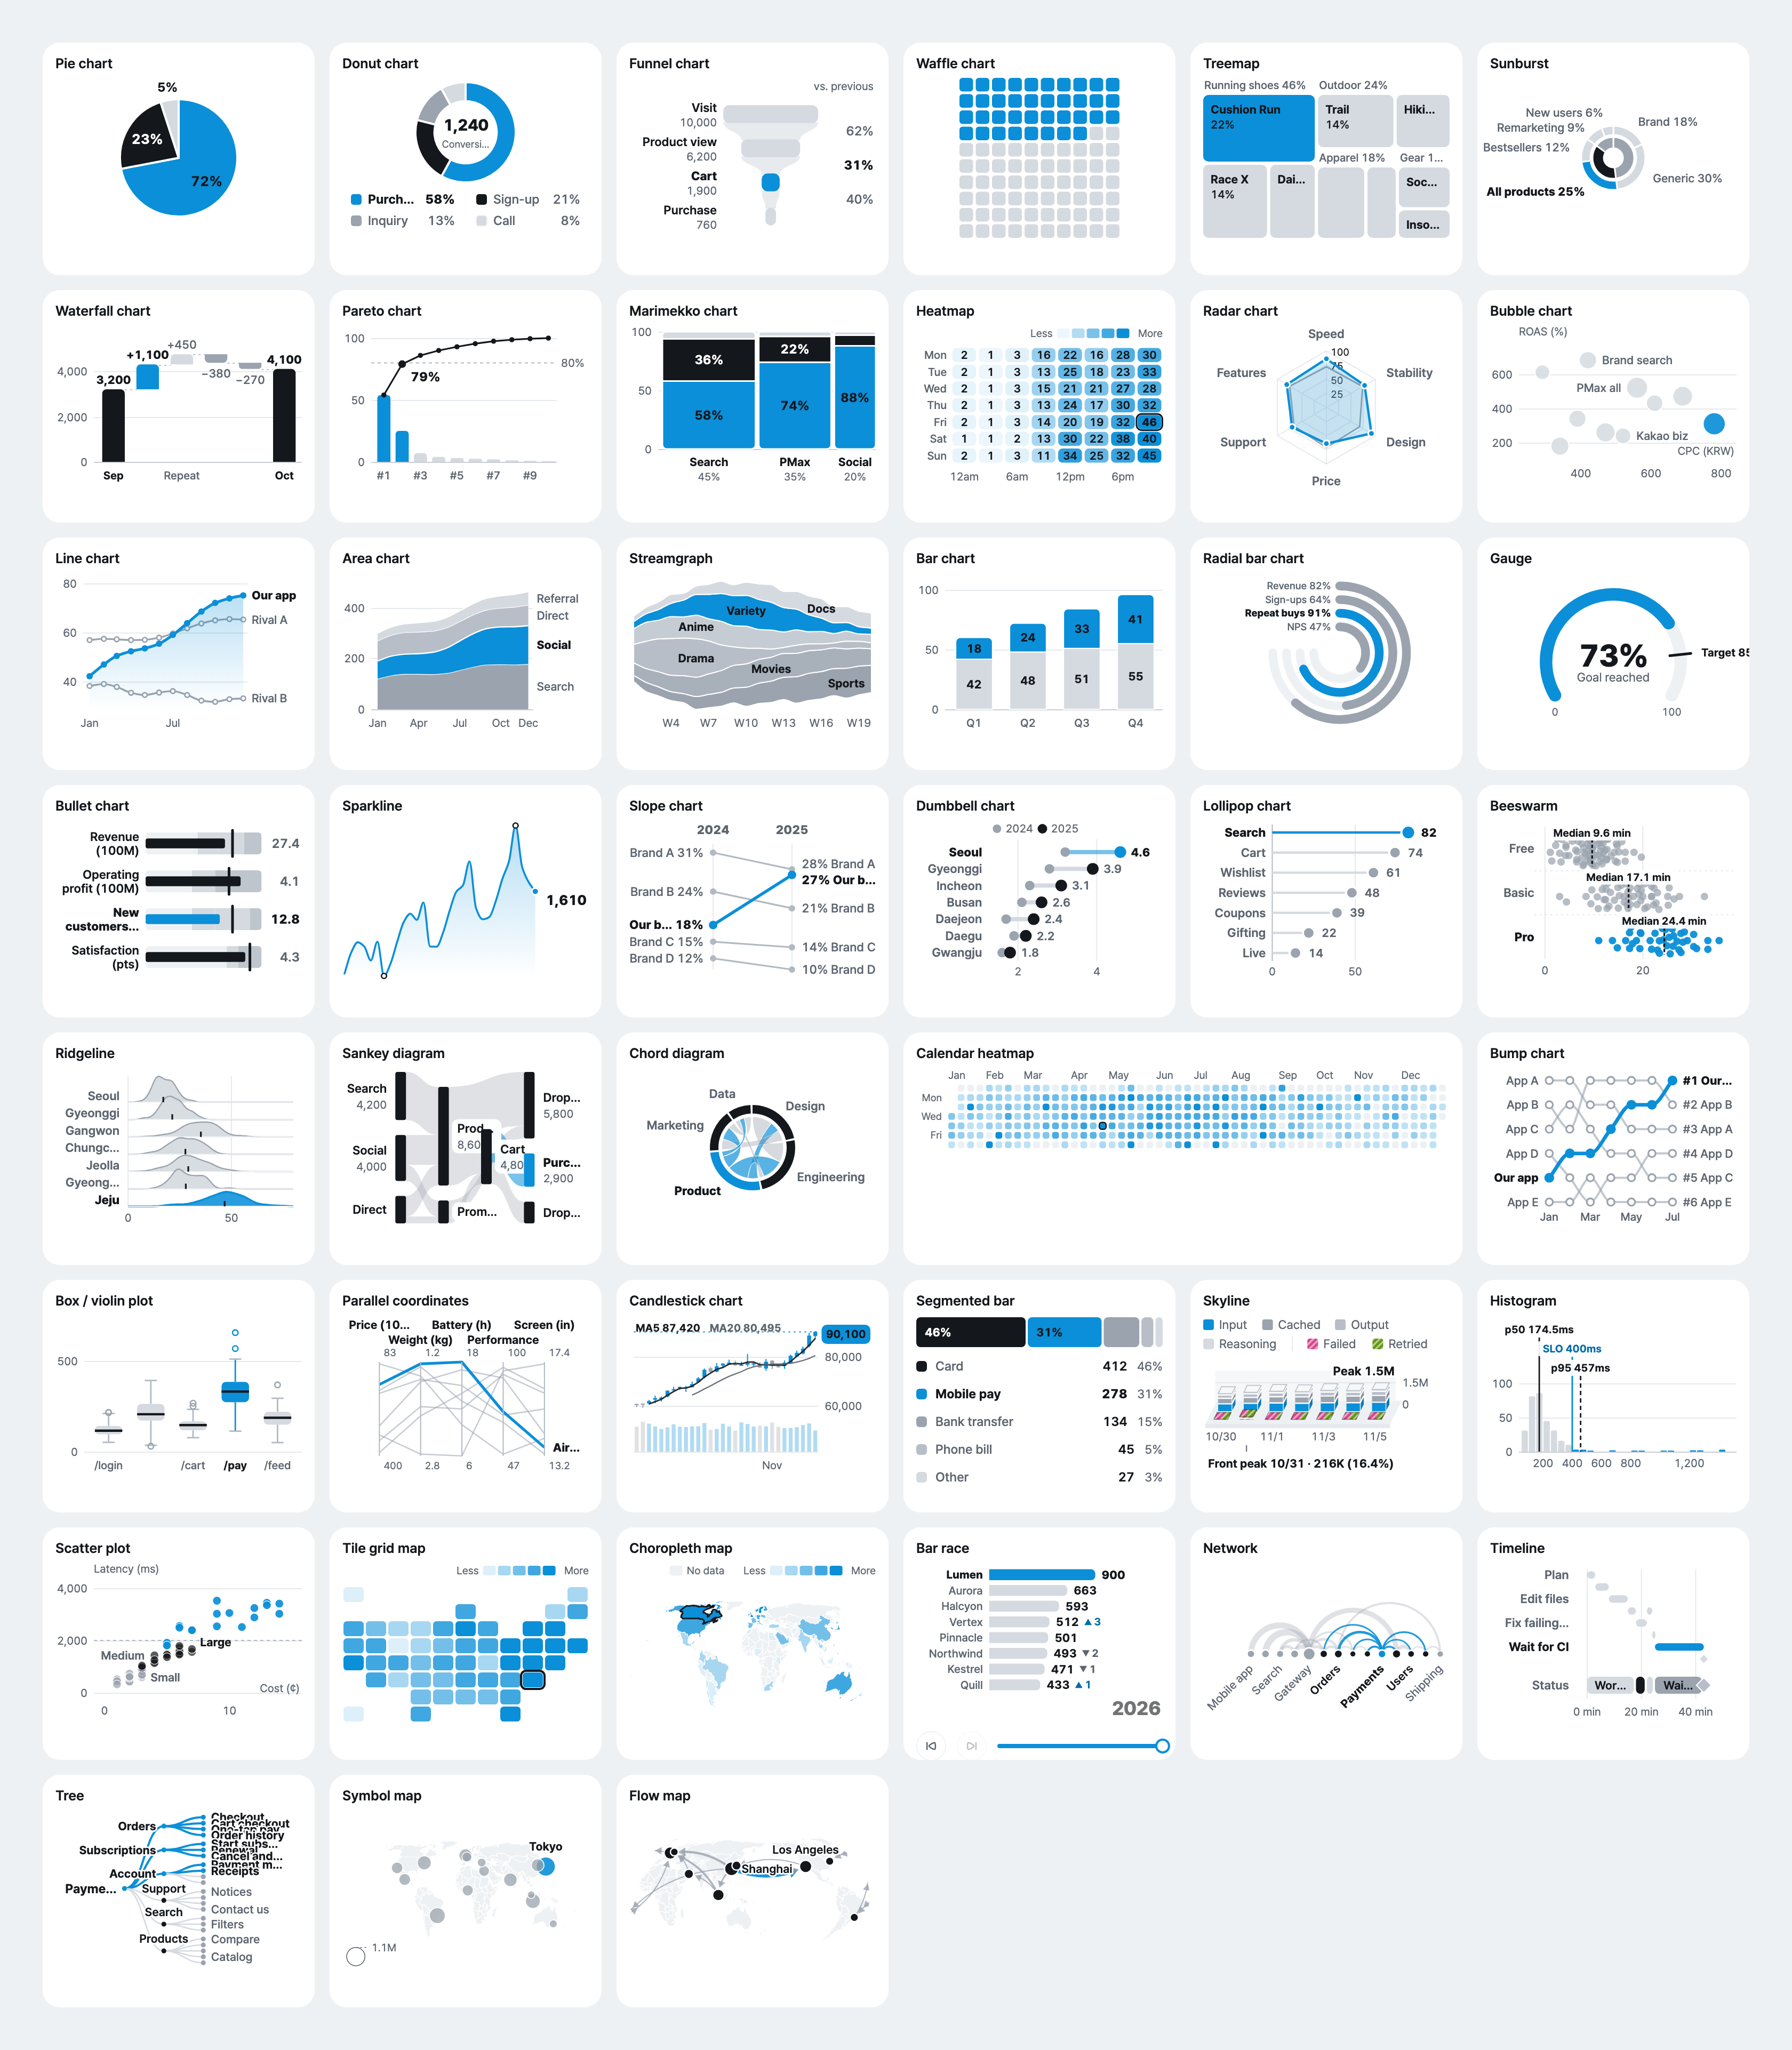
44 charts
| Group | Charts |
|---|---|
| Proportion | Pie · Donut · Waffle · Marimekko · Segmented bar |
| Hierarchy | Treemap · Sunburst · Tree |
| Flow | Funnel · Sankey · Chord |
| Comparison | Bar · Waterfall · Pareto · Radar · Slope · Dumbbell · Lollipop · Bar race |
| Trend | Line (range band too) · Area · Streamgraph · Sparkline · Calendar heatmap · Bump · Candlestick · Skyline · Timeline |
| Distribution | Box plot (violin too) · Beeswarm · Ridgeline · Histogram |
| Relationship | Heatmap · Bubble · Scatter · Parallel coordinates · Network |
| Map | Tile grid map, choropleth map, symbol map, flow map |
| KPI | Gauge · Bullet · Radial bar |
Each chart has a page with a live demo, its props and copyable code in the gallery. Why each one made the cut, and what was left out, is in the chart catalog.
Use it with AI
# Add the MCP server to Claude Code (Cursor and Claude Desktop are in the guide)
claude mcp add ztd-charts -- npx -y ztd-charts-mcp

# Chart ideas and ready specs from your data, then a PNG
npx ztd-charts-cli suggest sales.csv --out-dir charts
npx ztd-charts-cli render donut.json --out donut.png --theme light --scale 2
The MCP server lists charts, returns a chart's schema and example, validates a spec with suggestions for wrong fields, renders it to PNG, SVG and React code, and suggests charts from CSV, rows or a URL. The agent skill walks an agent from picking a chart to a checked preview, and llms.txt gives a model the whole library in one file.
Packages
| Package | What it is |
|---|---|
ztd-charts |
The React charts, cards, grid, themes and data hooks, plus spec tools (ztd-charts/spec) and server rendering (ztd-charts/server) |
ztd-charts-cli |
List, validate, render, start a project and suggest charts from the terminal |
ztd-charts-mcp |
An MCP server with five chart tools for AI agents |
Learn more
- Guide: common props, cards and grid, theme tokens, animation and interaction, accessibility, connecting data (REST, CSV, Supabase, Google Sheets, Postgres), the JSON spec, the CLI, the MCP server and development
- Docs site: every chart with a live demo, five example dashboards, data connection and a playground
- QA report: screenshots, contrast, frame rate, a 10,000-point stress test and bundle sizes
- Coming from
@junhanlee/chart-kit? See Migrating.
License
MIT. Every number in the examples is made up.
Releases